
How AI Automation Reduced a Client's Reporting Time by 90%

November 18, 2025
Project Summary
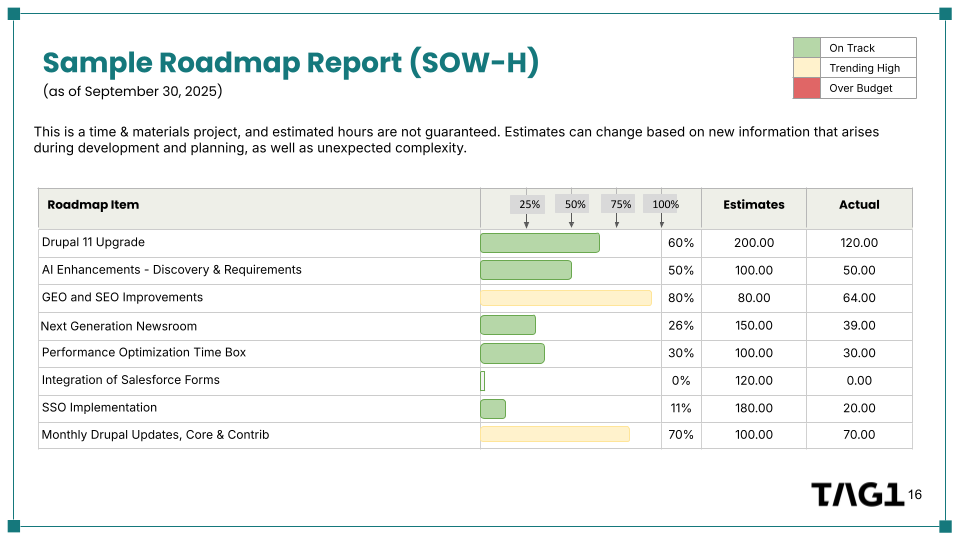
Project managers often spend as much time reporting as they do managing and for good reason: clear, accurate reporting gives clients the visibility they need to make informed decisions, justify budgets, and stay confident in a project’s direction. The right data presented the right way can make all the difference. For example, one of our large healthcare clients has very specific reporting requirements: all of our work is mapped to their digital roadmap categories and each month I deliver a report comparing estimates to actuals by category. Subtotals for each category are pasted into an “executive overview” slide deck that uses progress bars to nicely visualize their spend.
The Old, Manual Process
The manual steps involved in putting together this report were fairly onerous, usually taking a total of 8-10 hours to complete every month. Even though the 18-person project team does an amazing job of logging their hours appropriately, humans aren’t perfect and there are a lot of ways we can accidentally introduce errors:
- The original job ticket could have been misclassified under the wrong roadmap category.
- The original job ticket may not have been classified at all (and the developer had to use their best judgment when logging their time).
- The time was simply logged into the wrong task by mistake, which is the most common issue.
These errors, if not corrected, could add up over the course of a contract and substantially throw off actuals for the roadmap items. Although our time tracking software allows me to pull time logs per task, reviewing individual time logs is an enormous time sink. Often, reconciliation doesn’t happen until the end of the month, when there can be up to 800 rows of time logs to review.
That means every month, someone would have to spend hours:
- Downloading the individual time logs
- Validating the categorization by manually checking each row
- Sorting the Google Sheet by category
- Summing up the categories to capture subtotals
- Copying subtotals into the client-facing budget table
- Inserting subtotals into the visual executive status report slide deck
How I Used AI to Improve This Process
Going into this exercise, I had some specific things I was hoping AI could help with. My desired future state was:
- Use an AI tool to automatically validate and correct the categorization of tasks in the time logs
- Use a Google Apps Script to automate certain functionality that was done manually in the Google sheet
- Use standard formulas and lookups to get the necessary subtotals and populate them across the various budget tables and client overview slides
Gemini Was a Bust
My fundamental mistake was assuming that Gemini has some special capabilities within Google Sheets that other tools did not have. Spoiler: it doesn’t.
The original prompt I used in Gemini was:
Given the Task defined in Column B, can you update the Category
in Column E? Column E has a validation that should be used for
the category.
Gemini could not recognize the validation list, so I had to follow up with a list of categories. Then it wanted mapping logic. I reiterated that it should look at the contents of the Description and Task columns to assign the correct category from the list provided.
Even after providing category lists and follow-up prompts, Gemini produced results with only a few rows of data, critical columns of data missing, or categories that were just empty.
After at least 20 different prompt attempts, when I clearly sounded frustrated, Gemini responded:
I understand you'd like me to update the 'Category' column directly
in your spreadsheet. Unfortunately, I cannot directly modify your
Google Sheet. My capabilities allow me to analyze data and generate
content, but I cannot execute changes directly within your document.
At this point, I felt like Gemini was lying to me. As I was iterating on my prompts, I was sure Gemini had in fact modified my sheet and, in one iteration, even assigned useless/incorrect categories like ‘Other.’
I clearly made some mistakes with Gemini:
- Assuming Gemini had special Google Sheets capabilities
- Not realizing that the scope of a Gemini prompt in Google Sheets is limited to the current sheet. (In other words, you can't have it look at other sheets for information - such as my validation categories - as part of its task.)
- Not knowing that Gemini, apparently, cannot directly modify a spreadsheet. (The made up categories remain a mystery I have not been able to reproduce.)
Enter Claude
Can I just say that Claude was great? It got the job right on the first try. My prompt was straightforward:
I have a table of information with the following columns:
Description Task User Duration (decimal) Category
I would like you to look at the Task column and assign an appropriate
category from this category list: < I listed the categories. >
Provide the results back to me as tab delimited data.
If you have to make a judgment call on how to map a row, please provide
a list of how you mapped these. Here is the table of information:
< I included all rows from my spreadsheet. >
Claude nailed it. Some examples:
- An Analytics issue, originally listed as "Maintenance & Stability," was mapped to Analytics Enhancements because it specifically deals with analytics click tracking functionality.
- Storybook.js updates, with an incomplete task description in the original data, mapped to Maintenance & Stability, as Storybook.js updates are typically maintenance-related development tool improvements.
- Tasks with various meeting-related descriptions (standups, team meetings, client meetings, backlog refinement) were mapped to the Meetings category for consistency.
I was especially impressed by Claude's decision on the Analytics mapping. It used a new category we added a few weeks prior to track analytics specific tasks. Previously, these tasks were all logged in Maintenance by design, so the developer had categorized them correctly based on the old category, but Claude was also correct that these days we're doing it differently.
Copying categorized rows back and reviewing judgment calls took about 5 minutes. I only manually adjusted one row. Huge horrible categorization task DONE.
Next Step: Category Subtotals
Previously, I manually sorted rows and summed categories. Now, Claude suggested pivot tables and helped build formulas to:
- Pull category totals into an actuals rollup table
- Pull grand totals into a master budget sheet showing estimate vs actual
Now I had a sorted, properly categorized batch of work logs with pivot tables showing subtotals for each category.
Automation with an Apps Script
After the data was copied back into the spreadsheet with correct categories, I needed to get subtotals by Category. I used Claude to write a Google Apps Script that:
- Sorts by Category
- Creates a pivot table in the existing sheet showing Sum of Duration by Category
- Tracks whether the script has already run and overwrites if needed
- Logs each step and errors
- Is accessible via a custom menu labeled "Categories Pivot"
After a few error cycles refining column names and limits, the script worked perfectly. Automate the pivot tables DONE.
Results and Insights
I successfully achieved all future state goals:
- An AI tool that automatically validates and corrects task categorization
- A Google App Script that automates manual spreadsheet tasks
- Formulas and lookups that populate subtotals across sheets and slides
This reporting automation project streamlined the process of converting Clockify time logs into a clear, client-facing monthly report showing estimate versus actual hours for each roadmap category. By combining AI-assisted validation, Google App Scripts, and automated formulas, what previously took nearly a full day of work now happens in under an hour.
While the reporting process itself may be specific to internal operations, it demonstrates how Tag1 project managers are always finding ways to reduce costs without sacrificing quality. The value for clients is clear: faster, more accurate reporting with fewer errors, increased transparency into project progress, and cost-efficient processes that free up hours for higher-value work.
This post is part of Tag1’s AI Applied series, where we share how we're using AI inside our own work before bringing it to clients. Our goal is to be transparent about what works, what doesn’t, and what we are still figuring out, so that together, we can build a more practical, responsible path for AI adoption.
Bring practical, proven AI adoption strategies to your organization, let's start a conversation! We'd love to hear from you.
Image by tungnguyen0905 from pexels
Related Insights
-
/