
An AI-Powered PMO Business Intelligence Dashboard Built in Two Weeks

October 29, 2025
I'm Not a Developer. I Built This Anyway.
I built an AI-powered PMO Intelligence Dashboard that synthesizes data from multiple project management systems used at Tag1 (Jira, Clockify, Runn) into a unified portfolio view with automated risk detection and executive reporting. I wanted to demonstrate that operational roles, not just developers, can leverage AI to create strategic business tools.
The prototype is live at https://tag1-pmo-dashboard.netlify.app and serves as both a functional tool and a case study for how non-technical team members can build sophisticated software using AI assistance.
The Real Problem
As a Senior Project Manager (PM) often managing multiple simultaneous client projects, it’s typical to sometimes be drowning in data fragmentation. Every week it’s normal to spend hours manually compiling reports by:
- Pulling sprint and release management data from Jira
- Cross-referencing budget burn in a timesheet system like Clockify
- Checking team member allocations and time off in the resource management system, Runn
- Hunting through Slack for blockers, action items, and risks
- Synthesizing everything into executive summaries or actionable plans and prioritizations
- Surfacing risks and keeping tabs on active mitigations as needed
The real pain wasn't just the time, it was the cognitive load of holding multiple projects' worth of context in my head to identify compound risks. For example, when Project Beta’s budget hit 95% while the tech lead was overallocated and taking PTO next week, and a critical release was at-risk, I’d only catch that pattern if I happened to be looking at all systems simultaneously.
Why This Matters
Project Managers are often seen as “cat herders,” “meeting shepherds,” or even “documentation and process junkies.” Valuable, sure, but that’s not all we are, and we’re definitely not known as builders. This perception creates a ceiling: non-developers are constrained to using tools others build for them. AI demolishes that ceiling, empowering PMs to create, experiment, and innovate on their own terms.
This is the question I wanted to answer.
Can a PM with average technical literacy use AI to build strategic software that amplifies their expertise? It turns out the answer is a resounding yes!
Client Connection
Every client engagement involves portfolio visibility, risk management, and efficient communication. If I could prove this concept worked for internal operations, the same pattern could become a client deliverable, including custom intelligence dashboards that synthesize their fragmented data sources into actionable insights. That would be built in weeks instead of months and at a fraction of traditional development costs. Or, without the need of development at all.
Technical Overview of the Solution
The AI Stack
- Claude Sonnet 4.5 (via Tag1's AI proxy) – Strategic planning, architecture design, mock data generation
- Cline (VS Code extension) – Code generation, component building, debugging
- Tech Stack: React, Vite, Recharts, Tailwind CSS, Netlify (all selected by Claude based on requirements)
The Workflow: How I Used Claude + Cline Together
Here's what most people miss about AI-assisted development: the tools do different jobs. I treated Claude like a senior architect and Cline like a junior developer who executes perfectly when given clear instructions.
Phase 1: Strategic Planning with Claude
Week 1, Days 1–2
I started by having a long conversation with Claude, where I explained the following:
- My role as PM managing multiple projects
- The scattered data problem
- My vision: “I want to see all my projects' health in one place, with AI flagging risks I might miss.”
- My constraints: limited coding experience but familiarity with development and UI/UX best practices, must comply with Tag1 AI policies, needs to work with mock data first
Claude didn't just “build a dashboard.” It asked clarifying questions:
- Should this include sprint-level visibility, or just project-level?
- What constitutes a ‘risk’ in your workflow?
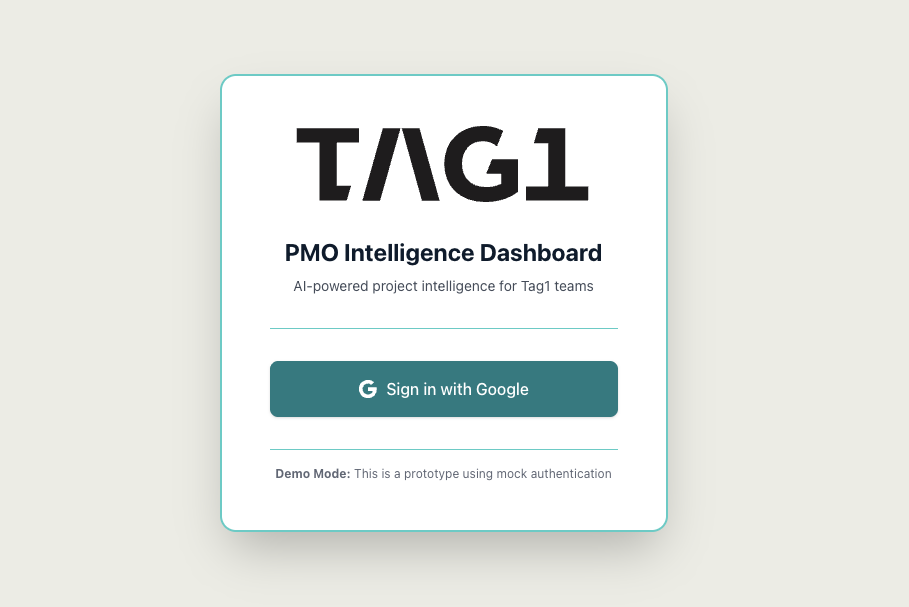
- Would authentication be important for a real deployment?
Through this dialogue, Claude helped me define the following:
- Six core features: project cards, sprint burndowns, budget charts, velocity trends, release roadmap, AI report generator
- A mock-first architecture: build with JSON files, but can easily swap in APIs later
- Tag1 brand compliance: extracted colors from brand guide, applied throughout
- AI risk detection logic: 13 specific risk patterns based on my PM expertise
Key Insight:
Claude translated my domain knowledge (what makes a project "at risk") into technical specifications (if budget >90% and timeline remaining >10% → HIGH risk, score +3 points).
The Prompts That Worked
Early strategic prompts to Claude:
I'm a PM with basic React knowledge. I want to build a dashboard
that shows me project health across Jira, Clockify, and Runn data.
I don't have API access yet, so I need to use mock data. Walk me
through how to architect this so it's easy to swap mock → real later.
Design validation prompts:
Here's a screenshot of what I envision [uploaded mockup]. What's
missing from a PM perspective? What risks should the AI flag that
I might not have thought of?
Handoff document creation:
I need to move this conversation to Cline for implementation.
Create a complete technical handoff document that includes,
data structures, component specs, Tag1 brand colors, file organization,
and step-by-step Cline prompts. Make it so detailed that someone
could pick this up 6 months from now.
Phase 2: Implementation with Cline
Week 1, Days 3-5; Week 2
Once Claude designed the architecture, I moved to VS Code with Cline installed. This was the approach I followed:
-
Give Cline high-level feature requests, not line-by-line code instructions
-
Let Cline make technical decisions, such as choosing optimal React patterns and suggesting Recharts for visualizations
-
Review and approve each component before moving to the next
-
Iterate when needed (for example, "The burndown chart labels are cut off; fix the margins")
Effective Cline prompts:
Create a ProjectCard component that displays budget, timeline,
velocity, resources, current sprint, and AI risk analysis.
Use Tag1 brand colors from the colors.js utility file.
Make it responsive and professional.
Build a Sprint Burndown Chart using Recharts that shows ideal vs
actual progress. Include these metrics: days remaining, completion
rate, points remaining. Use Tag1 primary color for the actual line.
What This Workflow Enabled:
- No context switching - Claude held the "why" and "what," Cline executed the "how"
- Progressive refinement - Each component built on the previous, with Cline maintaining consistency
- Learning by doing - I learned React patterns by reviewing what Cline generated, not by studying tutorials
Governance Compliance:
Every step stayed within Tag1's AI policies:
- Proxy routing - All AI calls through
ai.tag1.iowere logged and monitored, keeping all data on internally hosted models and services. - Mock data only - No real client information was used in the prototype
- Human-in-the-loop - I approved every component, every API call, and every deployment.
- Audit trail - Cline's Memory Bank stored all decisions and progress
.clineignore- Excluded credentials, environment variables, and sensitive files from AI context
PMO Dashboard Prototype
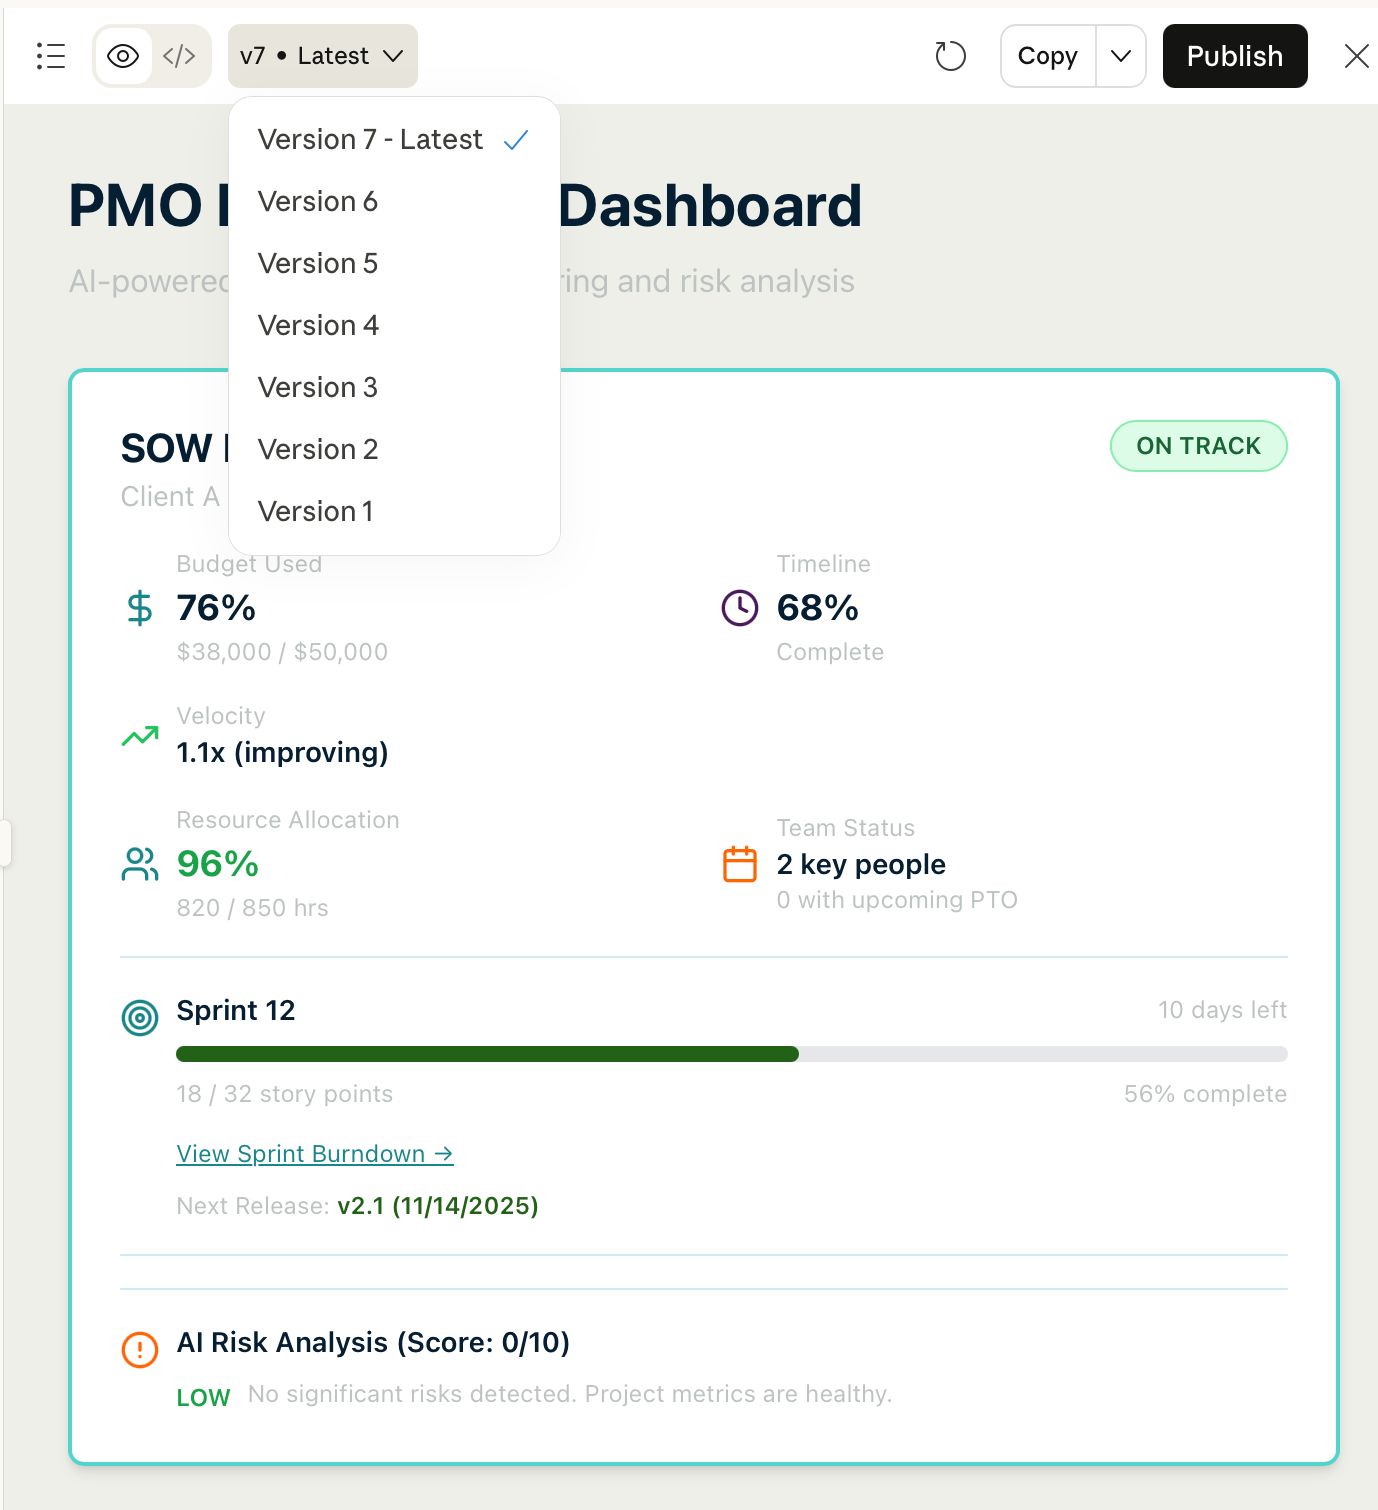
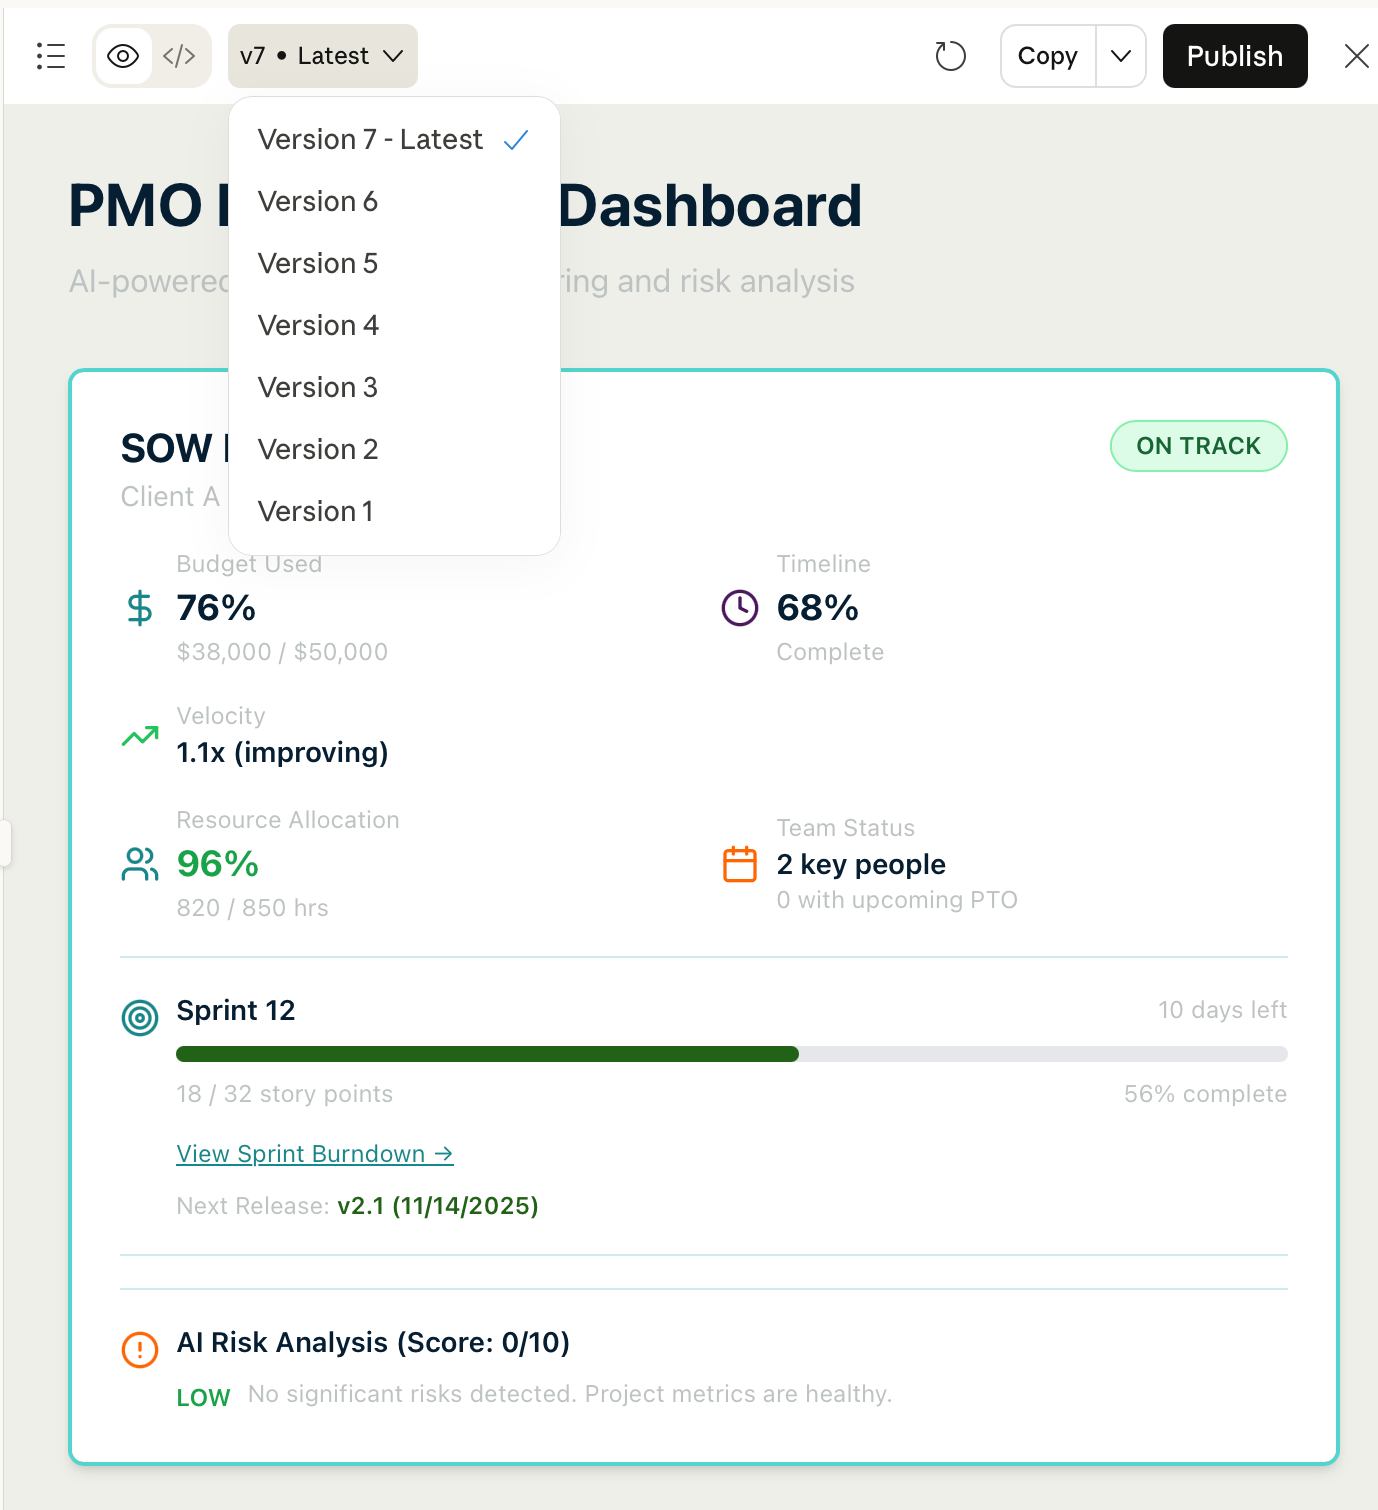
I’m excited to share the live prototype of our AI-powered PMO dashboard. This prototype demonstrates how project managers can consolidate data from multiple systems (Jira, Clockify, Runn) into a single portfolio view, with automated risk detection and executive reporting.
Live Prototype: https://tag1-pmo-dashboard.netlify.app
Note: This is a prototype using mock data; integration with real project data is planned for the next phase.
Quantifiable Outcomes
| Metric | Before | After | Improvement |
|---|---|---|---|
| Weekly status report prep | 5+ hours | 5 seconds (click “Generate Report”) | 99% reduction |
| Risk identification | Reactive, manual | Proactive, AI-flagged | Compound risks now visible |
| Portfolio visibility | Siloed across multiple tools | Unified single-pane view | 100% consolidation |
| Development cost | $50K+ (traditional dev) | $20/month (Claude Pro) | 99.96% cost reduction |
| Time to build | 3–6 months (agency timeline) | 2 weeks (solo PM) | 85–90% faster |
Qualitative Outcomes
What Changed:
- Cognitive relief - I no longer need to hold multiple projects' worth of context in working memory. The dashboard does it for me.
- Earlier risk detection - The AI caught a pattern I missed: Project Beta had declining velocity, budget overruns, upcoming PTO, and a critical release. Each factor alone is manageable; together they signal a crisis.
- Confidence in demos - When stakeholders ask, "How are the projects?", I pull up a live URL instead of fumbling through spreadsheets.
What I Learned:
- AI amplifies domain expertise, not coding skill - My value wasn't writing React; it was knowing what "at risk" means in a PM context. AI translated that expertise into working software. The lesson: your professional judgment is the rare asset; code generation is abundant.
- Mock-first architecture is a superpower - Building with JSON files first meant zero dependencies on API permissions, no blocked sprints waiting for IT approval, and instant iteration. The "swap mock → real" pattern is now my default for all prototypes. It’s easy to go from mock to real when you build with that in mind.
- The handoff document is everything - I asked Claude to create a multi-page planning document with technical specifications before writing any code. This wasn't overplanning, it was insurance. When I hit token or chat limits and needed to restart conversations (which happens in some AI models), this handoff document let me reconstruct context instantly.
- Brand compliance isn't optional - Using Tag1's exact color palette (
#16878B, not "teal") made this feel professional, not like a prototype. Small details compound into legitimacy. - Non-developers can build strategic software - The paradigm shift: I didn't "learn to code" to build this. I learned to translate business requirements into prompts. That's a different skill—and one PMs already have.
Pro Tip: Always create an initial comprehensive handoff doc and have your AI model you're working with update it after every major feature you build together. In this case, when working with Claude, I was able to easily save it to the project folder for persistent context.
How Clients Could Use This:
This isn't just a PM dashboard; it's a pattern for building custom business intelligence at 1% of traditional cost:
Immediate Applications:
- Client Project Visibility - Give clients real-time dashboards showing their project's health, not just status updates. They see sprint progress, budget burn, and AI-flagged risks—transparency that builds trust.
- Internal Operations for Client Teams - Many clients face the same problem Tag1 does: scattered data across multiple systems such as Jira, Asana, Monday, and more. We can deploy this architecture to pull their tools' data, delivering custom intelligence in weeks, not months.
- Portfolio Management for Agencies - Marketing agencies, consulting firms, professional services and anyone managing multiple client projects faces this fragmentation. This dashbaord becomes a repeatable, scalable deliverable.
Industry-Specific Use Cases:
- Healthcare: - Synthesize patient flow data, resource allocation, and regulatory compliance into a single operations dashboard, built on HIPAA-compliant architecture.
- Manufacturing: - Combine production metrics, supply chain status, and quality control data to flag bottlenecks before they cascade
- Financial Services: - Integrate CRM data, pipeline status, and compliance tracking for relationship managers overseeing 50 or more accounts.
- Higher Education: - Unify enrollment data, course capacity, and faculty allocation for academic operations teams.
The Value Proposition:
Traditional BI software such as Tableau, Power BI, Looker costs $70-100 per user per month and requires data engineering teams to build pipelines. This approach:
- Costs: $20-100 per month (AI subscriptions) plus one-time development
- Timeline: Weeks instead of quarters
- Customization: Built exactly for the workflow, not limited by tool constraints
- Maintenance: Updates via prompt, not developer sprints
Why This Matters Now:
I recently attended a Gartner webinar that noted AI maturity research shows most organizations stall at the "experimentation" stage. This project moves operational teams into "production" by demonstrating that AI can create strategic value outside of engineering. When a PM delivers working software, it changes the conversation around AI adoption.
Key Takeaways for Teams
For PMs:
- You don't need a CS degree (Ok yes, I do have one, but have I used it recently? Nope) to build strategic tools. You just need domain expertise, AI literacy and curiosity.
- Start with your biggest manual pain point. If you're spending many hours/week on something repetitive, it's
probablyautomatable.
For Developers:
- This isn't competition, it's complementary. PMs building prototypes lets you focus on production-grade systems, not proof-of-concepts.
- The "mock-first, API-later" pattern we used is a client engagement model: fast validation, then scale.
For Leadership:
- AI enablement isn't just about developer productivity. Operational roles creating software act as a force multiplier.
- The cost-to-value ratio here ($20/month subscription → tool that saves 5 hours per week) shows AI ROI isn't theoretical.
For Everyone:
- Having helped to facilitate Tag1’s AI Workshop for PMO, it bears repeating: AI doesn't replace your job; it removes the busywork that keeps you from strategic work.
Tag1's "All in on AI" opened up a new realm of possibilities. This project wouldn't exist without the permission structure to experiment, grow, and learn together.
What is Next
- Production-ready version: - Connect real APIs of systems to replace mock data
- Multi-project scaling: - Expand to cover many more projects for a full portfolio view
- Client pilot: - Deploy for a client engagement to validate the model
- Internal rollout: - Make this available to all Tag1 PMs and watch efficiency skyrocket
This project proves that project managers aren't just coordinators; we're builders.
And with AI, we're building faster than ever.
This post is part of Tag1’s AI Applied series, where we share how we're using AI inside our own work before bringing it to clients. Our goal is to be transparent about what works, what doesn’t, and what we are still figuring out, so that together, we can build a more practical, responsible path for AI adoption.
Bring practical, proven AI adoption strategies to your organization, let's start a conversation! We'd love to hear from you.
Image by Yan Krukau from pexels
Related Insights
-
/