
Goose 0.19: Watch Your Load Test While It Runs

November 5, 2026
Goose 0.19, the latest release of Tag1's open source load testing tool, lets you watch a load test in your browser while it runs. Response times, errors and active users update every second, so when a site starts to slow down you see it as it happens. Alongside it, goose-eggs 0.7 adds helpers for load testing WordPress and WooCommerce sites, and Goose itself can now fail a CI build when a site gets slower, keeps every response time to the microsecond, and runs in a quarter of the memory or less.
We compared Goose against k6 and Locust, all three in the same configuration of 1,000 users over HTTPS, running on the same two cores against the same web server. Goose sent 21,400 requests a second, against 15,800 for k6 and 8,400 for Locust, using less CPU per request than either and a fraction of the memory. The full results, and how we ran each tool, are found in this blog under the heading Compared with k6 and Locust.
Watch a Load Test in Your Browser
There's no new code to write. Any Goose 0.19 load test gets the live web dashboard once you turn on the experimental dashboard feature in Cargo.toml:
goose = { version = "^0.19", features = ["dashboard"] }Then add --dashboard to the command line and open http://127.0.0.1:5118/. Out of the box the page is read only. To start and stop the test and add or remove users from the browser, add --dashboard-control with either an auth token or --dashboard-no-auth (fine on your own laptop, less fine on a machine you share, and Goose prints a warning whenever you use it). The dashboard listens on localhost unless you tell it otherwise.
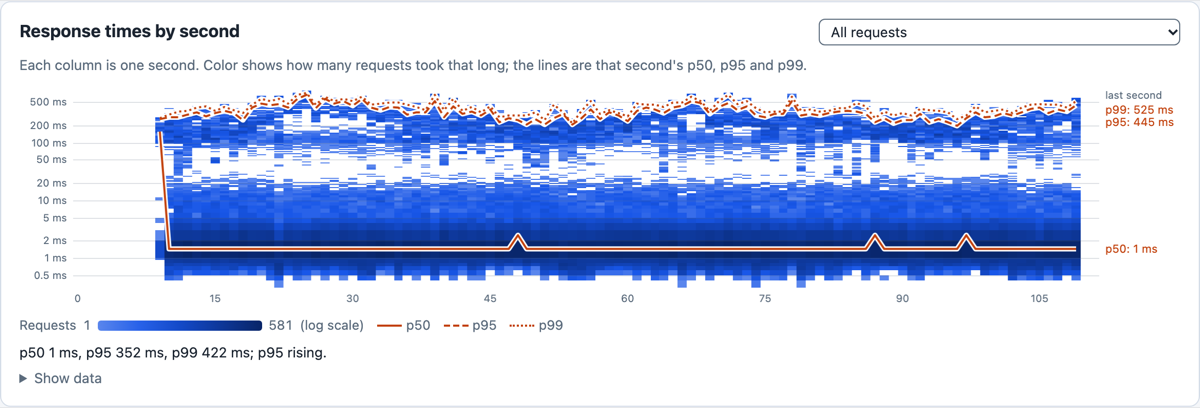
A useful new addition is the heatmap. Each column is one second of response times, so you can see a slow tail grow (or a cache warm up) long before it moves the average. You can show it for all requests or pick one request, so if only the checkout page gets slow, you can focus on it.
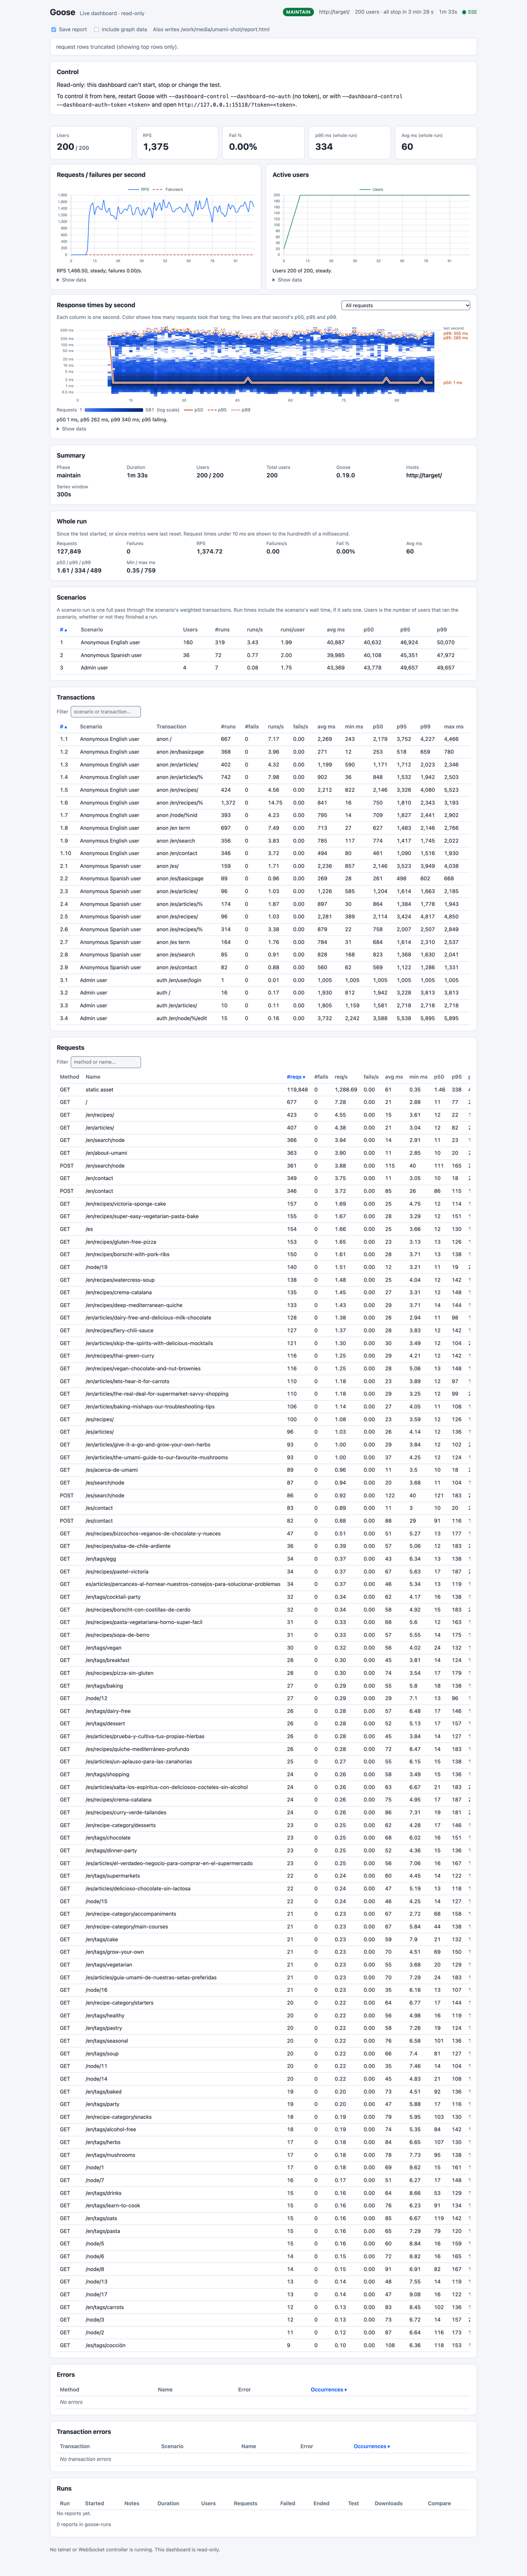
Below that are tables of every scenario, every transaction and the 100 busiest requests, and an errors table that fills in as errors happen. If you run with coordinated omission mitigation on (--co-mitigation average, for example), the requests table and the headline figures switch to coordinated omission adjusted times once mitigation has recorded an event. When a run ends, the dashboard can save its report into that run's own folder, so the runs panel lists earlier runs to download and compare.
The dashboard is opt in for 0.19. We'd like it to be on by default in 1.0, so please try it out and provide feedback. In the meantime it's cheap to leave on. In our 1,000 user memory tests it added about 2 MiB of memory and no added CPU we could measure. The Goose Book's dashboard reference says how that grows with more request names and longer runs.
Load Testing WordPress and WooCommerce
For years Goose has had Drupal helpers in goose-eggs, its companion crate, and an example load test against Drupal's Umami demo site. WordPress runs a much bigger slice of the web (nearly 40% of websites, by W3Techs' count), so goose-eggs 0.7 adds helpers for both WordPress and WooCommerce. The WordPress side logs in and out, searches, comments, creates and updates posts through the REST API, and finds content from the sitemap. The WooCommerce side browses the shop, searches, adds to the cart through WooCommerce's Store API (keeping each user's nonce through cart and checkout, as the Store API requires), checks out, and visits My Account.
The new woocommerce example in goose-eggs uses the helpers to simulate browsing shoppers, buyers and returning customers, and its README lists what a WooCommerce shop needs to run it.
Fail the CI Build When a Site Gets Slower
This one is less visual than the dashboard but is useful for day to day testing automation. Goose 0.19 adds thresholds: pass or fail rules given on the command line.
--threshold "p95<500ms" --threshold "error-rate<1%"
Rules can check any percentile, the average, the maximum, the error rate or requests per second, for the whole test or for one request (p99<2s for GET /checkout). Once all users are up and the test is holding at its target, Goose checks every rule once a second. The first rule to fail stops the test through Goose's killswitch, with a message naming the rule and what it saw. (If you'd rather run the whole test and judge it at the end, add --no-threshold-abort.)
Either way, a failed rule makes Goose return an error, so a load test whose main passes it up with ? (as every example does) exits nonzero, which is all a CI system needs to fail the build.
A GitHub Actions job that runs your load test against staging on every pull request, and fails when the site gets slower, looks like this (it tests whatever staging is running, so deploy the change there first):
name: load-test
on: [pull_request, workflow_dispatch]
jobs:
  goose:
    runs-on: ubuntu-latest
    steps:
      - uses: actions/checkout@v7
      - uses: dtolnay/rust-toolchain@stable
      - uses: Swatinem/rust-cache@v2
      - name: Run the load test with pass/fail rules
        run: |
          cargo run --release -- \
            --host "${{ vars.STAGING_URL }}" \
            --users 50 --increase-rate 10 --run-time 2m \
            --quiet --threshold "p95<500ms" --threshold "error-rate<1%" \
            --report-file report.html
      - name: Keep the report, pass or fail
        if: always()
        uses: actions/upload-artifact@v7
        with:
          name: goose-report
          path: report.html
The report is kept whether the job passes or fails, and it has a Thresholds section showing each rule, what it measured, and which one, if any, stopped the run.
Response Times to the Microsecond
Goose used to keep response times in whole milliseconds, which was fine for most websites but too coarse for very fast ones. Against a server answering in about 0.6 ms, 0.18.1 reported an average of 0.01 ms (lower than its own 1 ms minimum) and every percentile up to the 99th as 1 ms. 0.19.0 keeps every time to the microsecond (percentiles come from buckets, so they're never more than 1% off), and reports a median of 0.59 ms and a 99th percentile of 1.05 ms for the same server.
The console, HTML, Markdown and PDF reports and the dashboard show times under 10 ms to the hundredth of a millisecond. (0.19.0's JSON report still wrote its percentiles in whole milliseconds; 0.19.1 adds microsecond fields beside them.)


A Quarter of the Memory, or Less
Every release we try to make Goose cheaper to run, but this time the difference was big enough that we wanted real numbers before saying anything. So we ran Goose 0.18.1 and 0.19.0 on the same two cores of an arm64 machine in our Kubernetes cluster, against a small Rust web server on another machine. Each test ran five times per version, 20 minutes a run at 1,000 users and 10 minutes at 5,000, with the builds taking turns one run at a time. At 1,000 users, 0.19.0 with the dashboard on took a turn as well.
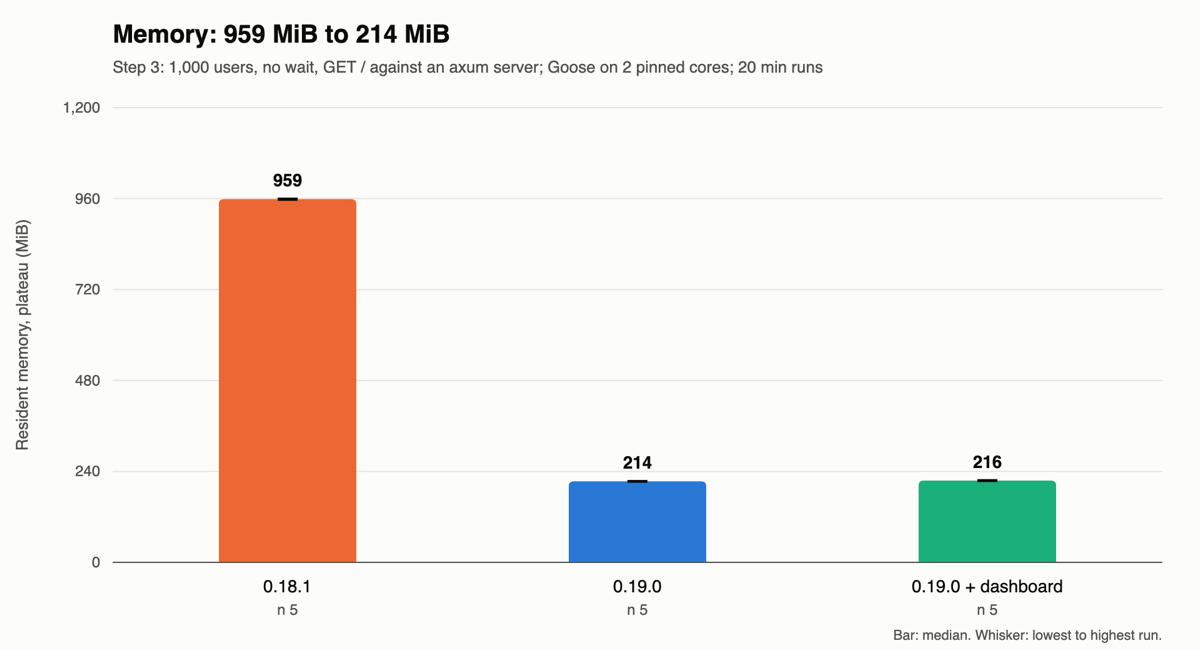
With 1,000 users requesting a page as fast as they could, 0.18.1 used 959 MiB of memory and 0.19.0 used 214 MiB. With a more realistic shape (5,000 users, each waiting 1 to 3 seconds between requests) 0.18.1 used 4,480 MiB and 0.19.0 used 763 MiB.
The biggest single piece of the old memory we could trace was TLS, even though these tests never used HTTPS. Every Goose user gets its own HTTP client (so each user keeps its own cookies and session, as a real browser would), and in 0.18.1 each of those clients had OpenSSL load and parse the system's whole certificate bundle into a store of its own. 0.19 moved to reqwest 0.13, which uses rustls, and building a client now costs a fraction of that.
CPU went down too, though less dramatically. In the 1,000 user test, 0.19.0 spent 9% less of its own CPU per request than 0.18.1, and ran 23% fewer instructions per request (at 5,000 users it was also 9% less of its own CPU, with about half the instructions). Requests per second went up about 5%, but we wouldn't lean on that one. Two builds of the same source varied by about 2% on this machine, and the kernel's network processing took more than half of those two cores.
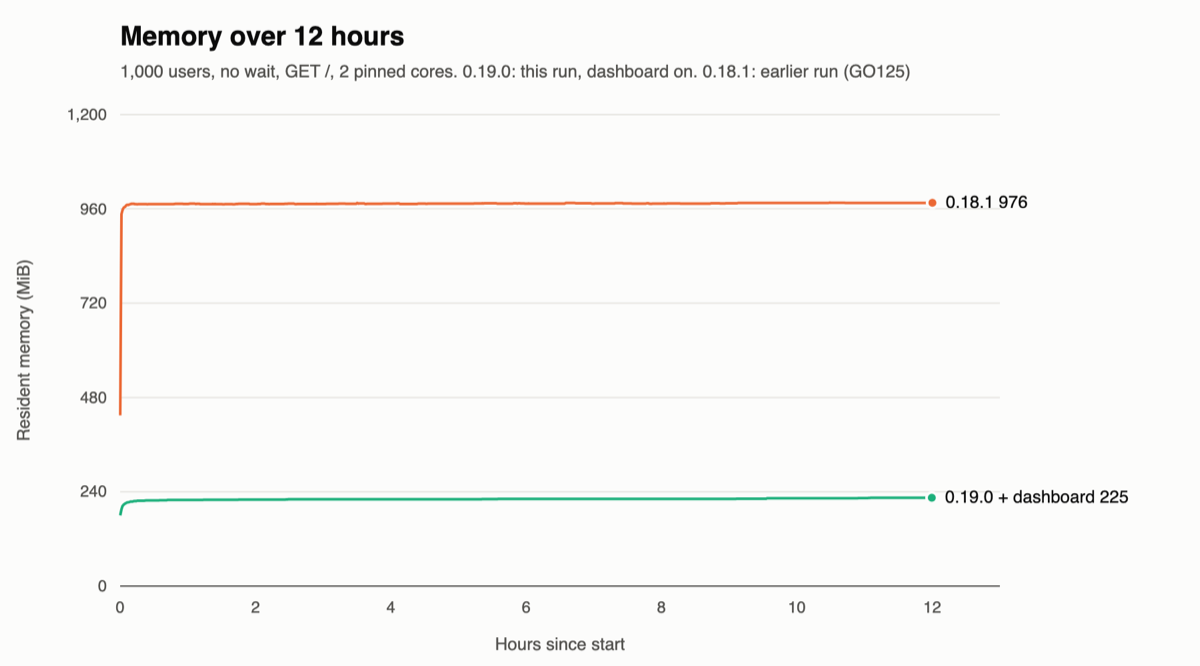
We also left 0.19.0 running for 12 hours with the dashboard open. It sent a little over a billion requests with no failures, and Goose's count matched the web server's own count exactly. Memory went from 219 MiB at the first hour to 225 MiB at the twelfth. Goose keeps a per second history for its graphs, which explains some of that growth, and we're still looking into the rest. Requests per second, CPU per request and the 99th percentile stayed flat the whole time.
Compared with k6 and Locust
All three tools sent requests with no wait between them. Locust ran FastHttpUser with two worker processes, one per core, as its docs recommend for throughput. k6 ran its constant-vus executor and, as k6's guide to running large tests recommends, discarding response bodies to save memory. Most real sites are HTTPS, so the numbers below are over HTTPS with certificates fully checked (Locust's FastHttpUser skips the check unless you turn it on, so we turned it on).
| Over HTTPS, 1,000 users, 2 cores | Goose 0.19.0 | k6 2.3.0 | Locust 2.47.0 |
|---|---|---|---|
| Requests per second | 21,432 | 15,838 | 8,415 |
| CPU per request, tool and kernel | 93 µs | 126 µs | 238 µs |
| Peak memory | 198 MiB | 1,388 MiB | 919 MiB |
The CPU row counts both the tool's own CPU (the user and system time charged to its processes) and the kernel's network processing for its connections (interrupt time not charged to the tool's processes), since both came out of the same two cores.
Over plain HTTP the order was the same for throughput and CPU, but Locust used a little less memory than Goose, 190 MiB against 212. Goose was higher because each of its 1,000 users builds its own HTTP client with a TLS certificate store (about 81 MiB in all) whether or not it ever speaks HTTPS. A load test that doesn't need cookies can avoid most of that cost, since set_client_builder_without_cookies gives every user one shared client.
The throughput and CPU gaps in the table may look smaller than you'd expect from a tool written in Rust. Asking for one tiny page as fast as possible puts a big share of each request's cost in the kernel's network processing, about 50 µs a request, and for Goose that was more than half of its CPU per request.
Counting only each tool's own CPU, Goose needed 41 µs per request over HTTPS, against 76 for k6 and 173 for Locust. Put another way, at 41 µs of its own CPU a request, one core is enough for Goose's own share of about 24,000 verified HTTPS requests a second. A real load test that logs in, fills carts and checks pages gives each tool more of its own work to do, so the gap in real world load tests is even wider.
Other Changes in 0.19
There's a lot more in this release than fits here, and the CHANGELOG has all of it. A few highlights:
- Every run can write its reports and logs into its own folder, and logs can be gzipped (a request log at the default gzip compression level was about 60 times smaller than plain JSON).
- PDF reports, with the
pdf-reportsfeature. --baseline-filecompares a run against an earlier report, with the difference shown in the HTML, Markdown and PDF reports.--increase-rate,--increase-time,--decrease-rateand--decrease-timereplace--hatch-rateand--startup-time, so a test can ramp down as well as up without writing a test plan.- The telnet and WebSocket Controllers now listen only on localhost by default, and the WebSocket Controller is off unless you ask for it.
Some of these change how existing load tests behave, so if you're coming from 0.18, read the Goose Book's Upgrading From 0.18 page first.
What's Next
Gaggles, Goose's distributed load tests (a manager process coordinating any number of workers), will be reintroduced in the 0.20 release. From there, we will focus on a stable 1.0. If you try the dashboard or thresholds, we'd love to hear how they go, good or bad, in a GitHub issue. If you're new to Goose, the Goose Book is the place to start.